
Spotting the Overlooked Odds
Look: the bookmakers’ odds are a mirror that reflects the crowd’s hype, not the engine’s whisper. When a team like Alpine gets a 7.5% implied probability for a podium and the market treats them like a backmarker, that’s a red flag. The market’s bias toward the top three is a habit, not a rule. Exploit it.
Reading the Grid Like a Book
Here’s the deal: start with qualifying times, but don’t stop at the headline. Dive into sector splits, especially the long‑straight sector where a low‑downforce chassis can surge. If a driver consistently shaves 0.02 seconds off a sector that most rivals lose, that’s a micro‑edge. Pair it with their historic start performance – a driver who gains three places on average off the line is a hidden gem.
When Weather Becomes Your Ally
Rain isn’t just a wet blanket; it’s a chaos catalyst. Mid‑field teams love wet conditions because tire choice evens the playing field. Spot a forecast that predicts a light drizzle for the final ten laps – the odds will still favor the front‑runners, yet the probability of a surprise podium spikes. Don’t ignore the “wet‑weather” market; it often lags the actual climate data.
Live Betting: The Real‑Time Edge
And here is why: live odds move slower than the cars. A safety car at Turn 1 resets the pack, but the bookmaker’s algorithm needs a few seconds to adjust. In that window, a 20% underdog can surge to a 4‑1 price. Bet fast, bet smart. Use a split-screen: race feed on one side, betting platform on the other, and pounce when the odds wobble.
Driver Form vs. Team Form
Check it. A driver on a struggling team can still be a value bet if his personal form outpaces the team’s recent average. Look at the last five races – if the driver’s qualifying rank is consistently two spots better than the team’s average, his performance is self‑driven. That differential translates into hidden value, especially in sprint races where qualifying matters more.
Statistical Lag and Bookmaker Margins
Most bookmakers embed a 5% margin on top of the true odds. Spot the disparity by converting odds to implied probability and subtracting the margin. If you land at a 22% true chance for a top‑ten finish but the listed odds suggest only 18%, you’ve found a value bet. The math is simple; the profit is sweet.
Psychology of the Crowd
Fans love drama. When a driver’s personal story goes viral – a comeback after injury, a rookie’s breakthrough – the odds inflate. That emotional surge is not data‑driven. Slice through the hype and focus on lap‑time trends. If the data says the driver is flat‑lining, the hype is overpriced. That’s your entry point.
Final tip: monitor the pit‑stop delta. A pit crew shaving half a second off a stop can propel a driver from 7th to 5th in the final laps. Bet on the driver with the fastest pit crew when the race is in its last third – that’s your opening.
About the author :

Related posts
Popular products
-
 Solid Woid Watch Winder Box S0020 Series
$192.99
Solid Woid Watch Winder Box S0020 Series
$192.99
-
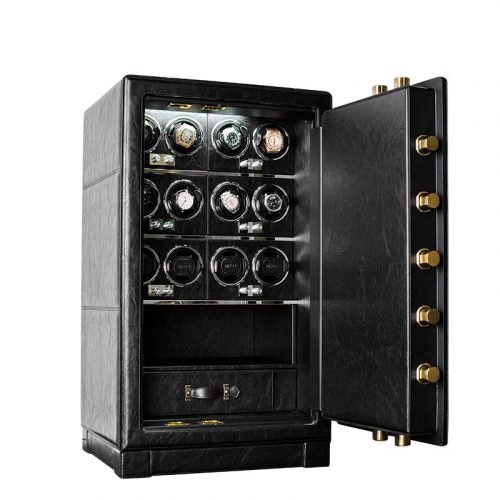 Dual Alarm Watch Winder Safe Box HP12 Series
Price range: $3,409.99 through $3,411.99
Dual Alarm Watch Winder Safe Box HP12 Series
Price range: $3,409.99 through $3,411.99
-
 Intelligent Winder Watch Z8200 Series
Price range: $304.99 through $1,210.99
Intelligent Winder Watch Z8200 Series
Price range: $304.99 through $1,210.99
-
 Watch Winder Safe Box B1120 Series
Price range: $6,815.99 through $6,817.99
Watch Winder Safe Box B1120 Series
Price range: $6,815.99 through $6,817.99
