
Why traditional prop bets fail
Most bettors treat player props like coin flips, ignoring the underlying volatility. Look: a point total line doesn’t tell you the story of a player’s usage rate, defensive matchups, or pace fluctuations. Those details are the oil that greases the gears of a winning edge. The market’s consensus often lags behind the real‑time data streams, creating a lag‑induced mispricing that the casual bettor never exploits. By the time the headline says “LeBron over 28.5,” the smart money has already shifted based on minute‑by‑minute shifts in lineup rotations.
Leaning on advanced metrics
Here is the deal: you need to bring Sabermetrics‑style rigor into your prop evaluations. Start with player efficiency rating (PER) and true shooting percentage (TS%) to gauge a scorer’s sustainable output, then layer in on‑court usage (USG%) and defensive matchup ratings. If a guard’s USG% spikes while his opponent’s defensive rating dips, the probability of a stat‑line surge skyrockets. Combine that with pace projections—teams like the Phoenix Suns push the ball faster than the Detroit Pistons, inflating counting stats across the board. The trick is to calibrate those numbers against the betting line, not the raw stat itself.
Dynamic line tracking and in‑game pivots
And here is why real‑time monitoring trumps static analysis. Lines move, sometimes by half‑point increments, as sportsbooks adjust to betting volume. Use a live line‑tracker tool to spot when a prop line drifts away from its statistical expectation. When the line nudges upward after a star injures a teammate, that’s a cue to re‑evaluate the prop—maybe the player will take on a bigger role, making the original line too low. In‑game pivoting is the next frontier: if you see a bench player logging minutes early, shift your wager to a prop that captures rebound or assist spikes. The market rarely re‑prices those micro‑adjustments instantly.
Bankroll math that actually works
Stop treating each prop like a lottery ticket. Deploy a Kelly‑based staking model tailored to prop volatility. Estimate your edge by comparing the implied probability of the line to the probability derived from your metric model. If your model says a player has a 58% chance to hit the over, and the line implies a 52% chance, that 6% edge justifies a modest unit allocation. Don’t chase the big wins; preserve capital for the next mispriced line. And remember: a single large loss can cripple a poorly sized bankroll faster than a series of small ones.
The final piece? Pull the data, trust the edge, and act before the market catches up. Your next move should be to set up a live spreadsheet that ingests pace, USG%, and opponent defensive ratings, then flags any prop where the model probability exceeds the sportsbook implied odds by at least five points. That’s the actionable hack that separates the winners from the wishful thinkers. Check the tools at nbaplayerbets.com for templates and alerts. Go.
About the author :

Related posts
Popular products
-
 Solid Woid Watch Winder Box S0020 Series
$192.99
Solid Woid Watch Winder Box S0020 Series
$192.99
-
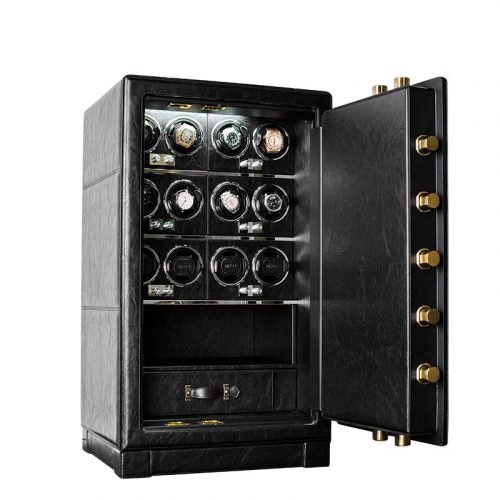 Dual Alarm Watch Winder Safe Box HP12 Series
Price range: $3,409.99 through $3,411.99
Dual Alarm Watch Winder Safe Box HP12 Series
Price range: $3,409.99 through $3,411.99
-
 Intelligent Winder Watch Z8200 Series
Price range: $304.99 through $1,210.99
Intelligent Winder Watch Z8200 Series
Price range: $304.99 through $1,210.99
-
 Watch Winder Safe Box B1120 Series
Price range: $6,815.99 through $6,817.99
Watch Winder Safe Box B1120 Series
Price range: $6,815.99 through $6,817.99
